
PPC REPORTING
PPC Reporting: What Your Report Should Include and Red Flags to Watch For
What a useful monthly PPC report includes, how to read one in about 10 minutes, and the warning signs that your ad budget is at risk.
ESTIMATED READ TIME: 12 MINUTES
Want a second opinion on your current PPC report?
Every month, plenty of small business owners open a PPC report, scroll past a wall of charts, see that “impressions are up,” and close it. They still don’t know the one thing they need to know: did the ads bring in paying customers, and was it worth the money?
That is not your fault. Many PPC reports are built to look busy, not to answer business questions. A good report does the opposite. It tells you what you spent, what you got back, what changed, and what happens next.
At Subsilio Consulting, we run digital ads for local and small businesses in Denver and across the US, and reporting is where trust is won or lost. This guide shows you exactly what a PPC report should include, how to read one in about 10 minutes, and the red flags that tell you your money may not be in safe hands.
Key Takeaways
- A good PPC report starts with business results (leads, calls, sales, cost per lead), not clicks and impressions.
- Ad spend and management fees should always be shown separately. Google’s own policy expects agencies to be transparent about costs and fees.
- You should own your ad account and be able to log in at any time.
- Search terms, tracking health and “what we changed” sections separate a real report from a template.
- If your report only shows clicks, impressions and click-through rate, it is not telling you whether the ads work.
What Is PPC Reporting?
PPC reporting is the regular summary of how your pay-per-click advertising performed over a set period, usually a month. It covers platforms like Google Ads, Facebook and Instagram Ads, LinkedIn Ads and Microsoft Advertising.
A report has three jobs:
- Show results. What did you get for your money?
- Explain why. What worked, what didn’t, and what caused the change?
- Set the plan. What will be done next, and why?
If a report does only the first job, it is a scoreboard. If it does all three, it is a management tool you can actually use.
Why PPC Reporting Matters More Than Ever
Ad platforms now automate much of the work. Smart bidding sets your bids. Broad match and AI-driven campaigns choose many of the searches you show up for. Automated assets write parts of your ads.
That automation can work well, but only if two things are true:
- The platform is learning from the right signal (real leads and sales, not page views).
- Someone is checking where the money actually goes.
Your report is where you see both. When reporting is weak, automation can quietly spend money on the wrong searches, the wrong audiences, or “conversions” that never turn into customers.
What Your PPC Report Should Include
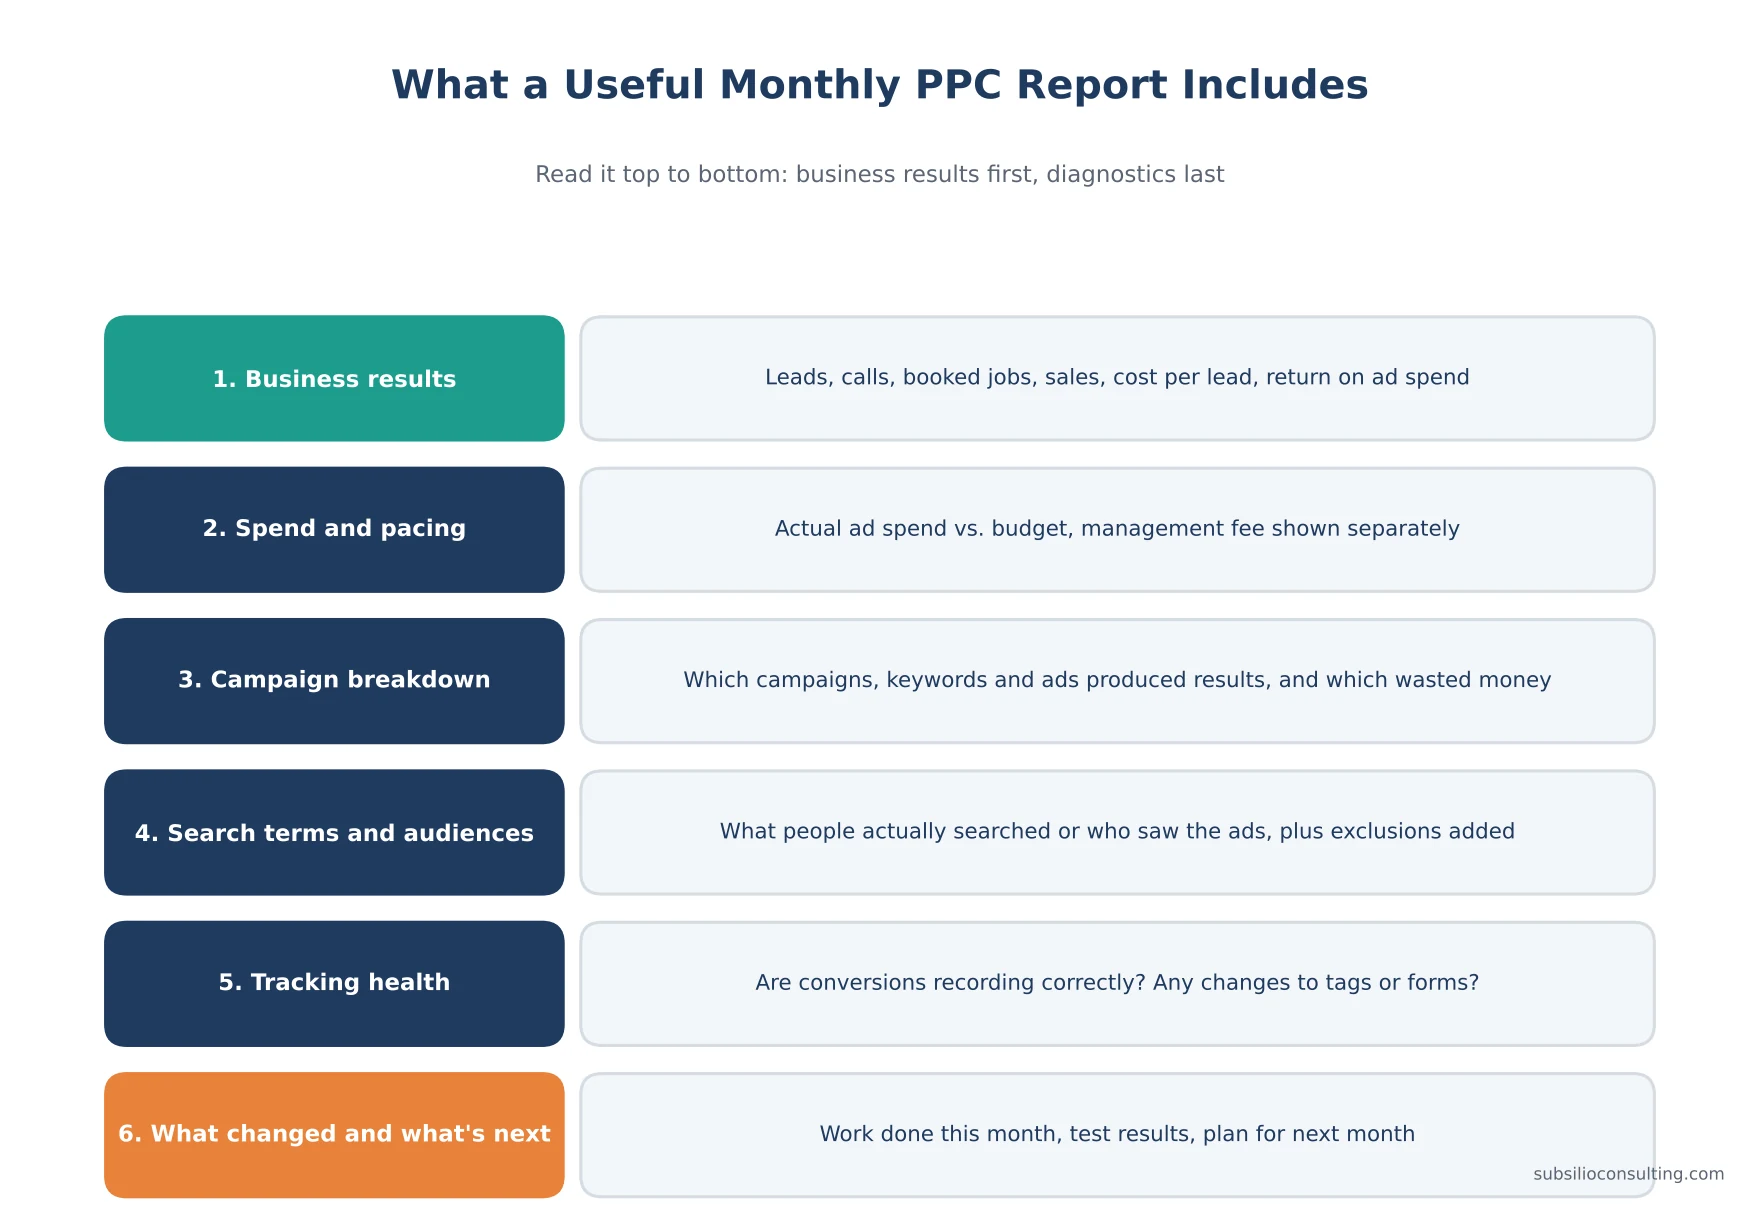
Read a PPC report top to bottom: business results first, diagnostics last.
Here is the structure we recommend. You can use it to judge the report you get now, or to brief whoever manages your ads.
1. An Executive Summary
The first section should fit on one screen and answer:
- How many leads, calls, bookings or sales did the ads produce?
- What did each lead or sale cost?
- How does that compare with last month and the same month last year?
- What is the one thing that mattered most this month?
If you have to read four pages to find out whether the ads worked, the report is built for the agency, not for you.
2. Business Results (Conversions That Mean Money)
This is the heart of the report. Look for:
- Conversions by type. Phone calls, form submissions, bookings and purchases should be listed separately. “10 conversions” means nothing if 8 were newsletter sign-ups.
- Cost per conversion (cost per lead or cost per acquisition). Total ad spend divided by real leads or sales.
- Conversion rate. The share of clicks that became leads.
- Conversion value and return on ad spend (ROAS) for ecommerce, or estimated pipeline value for lead generation if you share deal values.
- Lead quality notes. How many leads were real prospects, spam, or wrong service area? The best reports include feedback from your sales team or CRM.
If you track only one thing, track cost per qualified lead. It ties ad spend to something your business cares about.
3. Spend, Budget Pacing and Fees
A good report shows:
- Actual ad spend for the period, exactly as charged by the platform.
- Spend versus the agreed budget, and whether the account is on pace.
- The management fee as a separate line.
This matters for a simple reason. If spend and fees are blended into one number, you cannot work out your true return. Google’s third-party policy requires agencies that manage Google Ads for clients to be upfront about their services and costs, and Google’s transparency requirements state that advertisers should be told in advance if management fees apply. Google’s advertiser guide to working with third parties also says you have a right to know, at a minimum, the clicks, impressions and cost of your Google ads.
If you want to understand what a fair fee looks like, see our guide to PPC management pricing.
4. Campaign, Ad Group and Keyword Performance
You don’t need every row of data, but you should see:
- Which campaigns brought the most leads and at what cost.
- Which keywords or audiences spent money without results.
- Which ads performed best, with a note on what is being tested.
A useful format is “top 5 and bottom 5.” The top shows where to put more money. The bottom shows where money is being wasted and what was done about it.
5. Search Terms and Exclusions (Google Ads)
Keywords are what you bid on. Search terms are what people actually typed. These can be very different, especially with broad match.
Your report should include a short summary of the search terms report: new terms that brought leads, irrelevant terms that cost money, and the negative keywords added to block them. If your manager never mentions search terms, ask why. This is one of the most common places for budget to leak, and it is a core item in our Google Ads audit checklist.
6. Audience and Placement Insights (Social and Display)
For Facebook, Instagram, LinkedIn and display ads, the equivalent of search terms is:
- Which audiences (cold, warm, retargeting) produced results.
- Which placements (feed, stories, reels, apps, websites) used the budget.
- Frequency: how many times the same people saw the ads.
High frequency with falling results usually means people are tired of the creative. If you run retargeting, the report should show retargeting results separately from new-customer campaigns, because retargeting almost always looks cheaper.
7. Tracking Health
This is the section most reports skip, and the one that protects you most. Ask your manager to confirm each month:
- Are all conversion actions recording?
- Did any forms, phone numbers or website pages change?
- Are any conversions double counted?
- Are offline results (closed deals) being imported?
If tracking breaks, every other number in the report is unreliable. Read our guide to Google Ads and Facebook Ads conversion tracking for a full setup walkthrough.
8. What Changed This Month
A list of actual work done, for example:
- Added 42 negative keywords after search term review.
- Paused two ads with low conversion rate, launched a new offer test.
- Moved budget from Campaign A to Campaign B because cost per lead was lower.
- Fixed a broken thank-you page that stopped form tracking for three days.
This shows you what you are paying for. It also helps explain changes in results.
9. Insights and Next Month’s Plan
The report should end with clear next steps: what will be tested, what budget changes are recommended, and what the agency needs from you (new photos, offer details, sales feedback). A plan with dates is a sign of a team that is actively managing your account.
Metrics That Matter vs. Vanity Metrics
| Metric | What it tells you | How much weight to give it |
|---|---|---|
| Leads, calls, bookings, sales | Whether ads produce business | Highest |
| Cost per lead / cost per acquisition | Efficiency of spend | Highest |
| Return on ad spend (ecommerce) | Revenue per dollar spent | Highest |
| Conversion rate | How well the landing page and offer work | High |
| Search impression share | How often you showed when you could have | Medium (diagnostic) |
| Click-through rate (CTR) | How appealing the ad is | Medium (diagnostic) |
| Average cost per click | Price of traffic | Medium (diagnostic) |
| Impressions | How often ads were shown | Low on its own |
| Clicks | Traffic volume | Low on its own |
Clicks and impressions are not useless. They help diagnose problems. But they should never be the headline of a report, because they don’t pay your bills.
How Often Should You Get a PPC Report?
For most small businesses:
- Monthly report with full analysis and next steps.
- Live dashboard you can check anytime.
- Quick weekly check-in (email or call) for new campaigns, big budgets, or seasonal pushes.
Avoid judging performance on a few days of data. Results swing day to day, especially at small budgets. Look at trends over 30 days or more, and compare against the same period last year when seasonality matters.
PPC Reporting Red Flags to Watch For
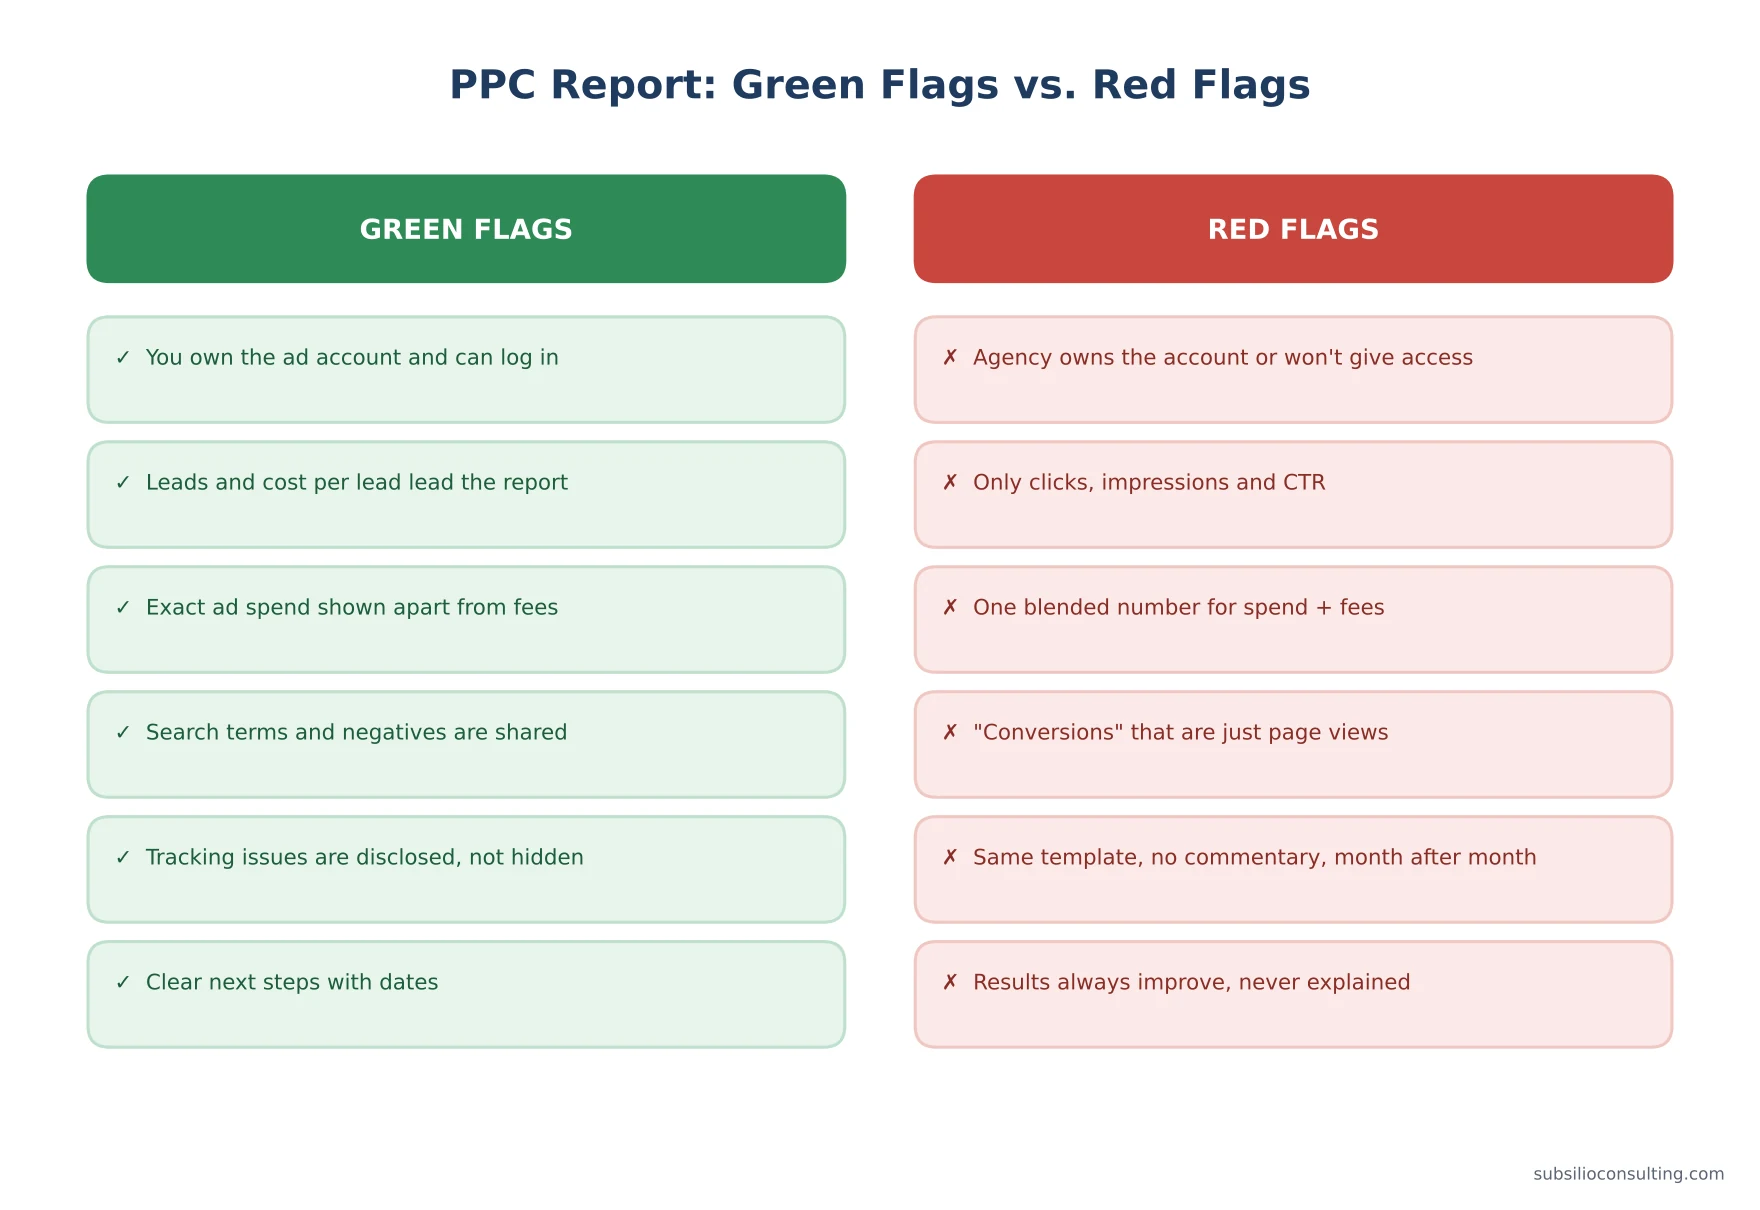
Use these green and red flags to judge any PPC report or agency.
These are the warning signs we see most often when businesses come to us for a second opinion.
Red Flag 1: You Don’t Own Your Ad Account
If the agency created the Google Ads or Meta ad account under its own business and will not give you admin access, that is the biggest red flag of all. If you leave, you may lose years of data, conversion history and audiences. You should own the account and give the agency access, not the other way round. Google’s guidance also notes that you can meet reporting requirements by signing in to your own account to see cost and performance data.
Red Flag 2: The Report Only Shows Clicks, Impressions and CTR
If there is no mention of leads, calls or sales, ask why. Either tracking isn’t set up, or the results are not good enough to show.
Red Flag 3: Spend and Fees Are Blended
“Your investment this month was $3,000” is not enough. You need to see exactly what went to the ad platform and what went to management.
Red Flag 4: “Conversions” That Aren’t Real Conversions
Some accounts count page views, button clicks or time on site as conversions. These can make results look excellent while the phone stays quiet. Ask for a list of every conversion action and which ones are used for bidding.
Red Flag 5: Results Always Look Good
No account improves every single month. A report that never admits a dip, a failed test or a tracking issue is being managed for appearances.
Red Flag 6: Same Template, No Commentary
If last month’s report and this month’s report could be swapped without anyone noticing, nobody is analysing your account.
Red Flag 7: No Search Term or Audience Detail
Without it you cannot see whether your money is reaching the right people.
Red Flag 8: Reports Arrive Late or Not at All
Inconsistent reporting usually reflects inconsistent management.
Red Flag 9: Leads in the Report Don’t Match Leads in Your Inbox
If the report says 60 leads and your team received 25, something is wrong: duplicate counting, spam, or the wrong action being tracked. Raise it immediately.
Red Flag 10: Vague Answers to Simple Questions
“The algorithm is still learning” can be true for a few weeks. It is not an answer for six months of poor results.
Questions to Ask Your PPC Manager
Use these to test any report or agency:
- Do I have admin access to every ad account you manage for me?
- Which conversion actions are used for bidding, and how are they tracked?
- What was my exact ad spend, and what was your fee?
- What did each qualified lead cost this month?
- Which search terms or audiences wasted the most money, and what did you do about it?
- What did you change this month, and what will you test next?
- How do your lead numbers compare with what my team actually received?
A good manager will answer each of these quickly and without jargon.
A Simple PPC Report Template You Can Use
If you manage ads yourself or want to brief an agency, here is a one-page structure:
| Section | What to include |
|---|---|
| Summary | 3–5 sentences: results, cost per lead, biggest change, top priority |
| Results | Leads by type, cost per lead, conversion rate, sales or value |
| Spend | Ad spend vs. budget, fee shown separately |
| Performance | Top and bottom campaigns, keywords/audiences, ads |
| Search terms / audiences | New winners, wasted spend, exclusions added |
| Tracking health | Any issues found and fixed |
| Work completed | Bullet list of changes |
| Next month | Tests, budget changes, what we need from you |
How We Approach PPC Reporting at Subsilio
Our reports start with the numbers business owners care about: calls, leads, booked jobs and cost per lead. You own your accounts. Ad spend and fees are shown separately. Every report includes what we changed, what we learned, and what we will do next. We also check that leads in the ad platform match leads your team receives, because that is the only number that really counts.
If you’d like a second opinion on your current PPC report, book a free consultation and we’ll walk through it with you.
Conclusion: A Good Report Protects Your Budget
A PPC report is not a formality. It is how you know whether your advertising is an investment or an expense. The right report puts leads, cost per lead and real sales first, shows every dollar of spend separately from fees, explains what changed, and tells you what happens next.
If your current report leaves you with more questions than answers, that is a signal worth acting on. Start by asking the seven questions above. If the answers are unclear, it may be time for a fresh look.
Subsilio Consulting helps Denver and US small businesses run Google Ads, Facebook Ads and more with honest reporting. Contact us for a free review of your current PPC account and report.
Want a PPC Report You Can Actually Read?
Our reports lead with calls, leads and cost per lead, with ad spend and fees shown separately. Book a free review of your current account and report.
Frequently Asked Questions About PPC Reporting
Q1. What should be included in a PPC report?
A PPC report should include an executive summary, conversions by type (calls, forms, bookings, sales), cost per lead or acquisition, ad spend versus budget with fees shown separately, campaign and keyword performance, search term or audience insights, tracking health, work completed, and next month’s plan.
Q2. What are the most important PPC metrics for small businesses?
The most important PPC metrics are number of qualified leads or sales, cost per lead, conversion rate and, for ecommerce, return on ad spend. Clicks, impressions and click-through rate are useful for diagnosing problems but should not be the main measure of success.
Q3. How often should I receive a PPC report?
Most small businesses should receive a detailed monthly PPC report plus access to a live dashboard. New campaigns, large budgets and seasonal promotions benefit from short weekly updates as well.
Q4. Should I own my Google Ads account if an agency manages it?
Yes. You should own your Google Ads and Meta ad accounts and grant your agency access. Owning the account protects your data, conversion history and audiences if you ever change providers.
Q5. Why don’t the leads in my PPC report match the leads my team received?
Common causes include duplicate conversion tracking, spam form submissions, counting button clicks instead of completed calls or forms, and conversions from other channels being attributed to ads. Ask your manager to audit conversion actions and compare platform data with your CRM or call log.
Q6. What is a good cost per lead for Google Ads?
There is no single good number. Cost per lead depends on your industry, location, competition, offer and how much a customer is worth to you. The right target is the cost per lead that keeps your customer acquisition cost profitable based on your average job value and close rate.
Q7. What are the biggest red flags in a PPC report?
The biggest red flags are not owning your ad account, reports that only show clicks and impressions, ad spend blended with management fees, vague or inflated “conversions,” no search term or audience detail, and results that never come with an explanation.
Q8. Can I build my own PPC report?
Yes. Google Ads, Meta Ads Manager and Google Analytics all have built-in reporting, and you can combine them into a simple monthly summary using the template above. The key is to lead with business results and keep a log of changes.